All blogs > Project Review
Project Review: Triple Uni 2024 Year Report
Table of Contents
Report Demo
You can view an Interactive Demo on the right side if your screen width exceeds 900px. Interact with it to explore the annual report generated for a sample user.
For mobile users or those preferring a separate page, visit this link to experience the full report.
Introduction
Triple Uni is an anonymous blogging platform exclusive to university members from HKU, CUHK, and HKUST. With over 24,000 registered users, we serve more than 6,000 monthly active users who view, comment, and publish blogs.
Annually, we compile personalized summaries showcasing each user’s activities including online minutes, post counts, rankings relative to peers, earned achievements, and other metrics. This year, we innovatively integrated generative AI to create unique artwork and textual summaries based on user activity.
Project Team
This project required collaborative efforts from a team consisting of:
- Copywriter - Curated relevant data and drafted display text
- UI Designer - Established visual themes and created static designs
- Backend Developer - Calculated user statistics and built APIs
- Frontend Developer - Translated designs into an interactive web experience with animations
Frontend Implementation
I choose Vue3 + Nuxt as the frontend framework for this project and utilized Server Side Rendering to optimize loading speeds.
UI Design Prototype
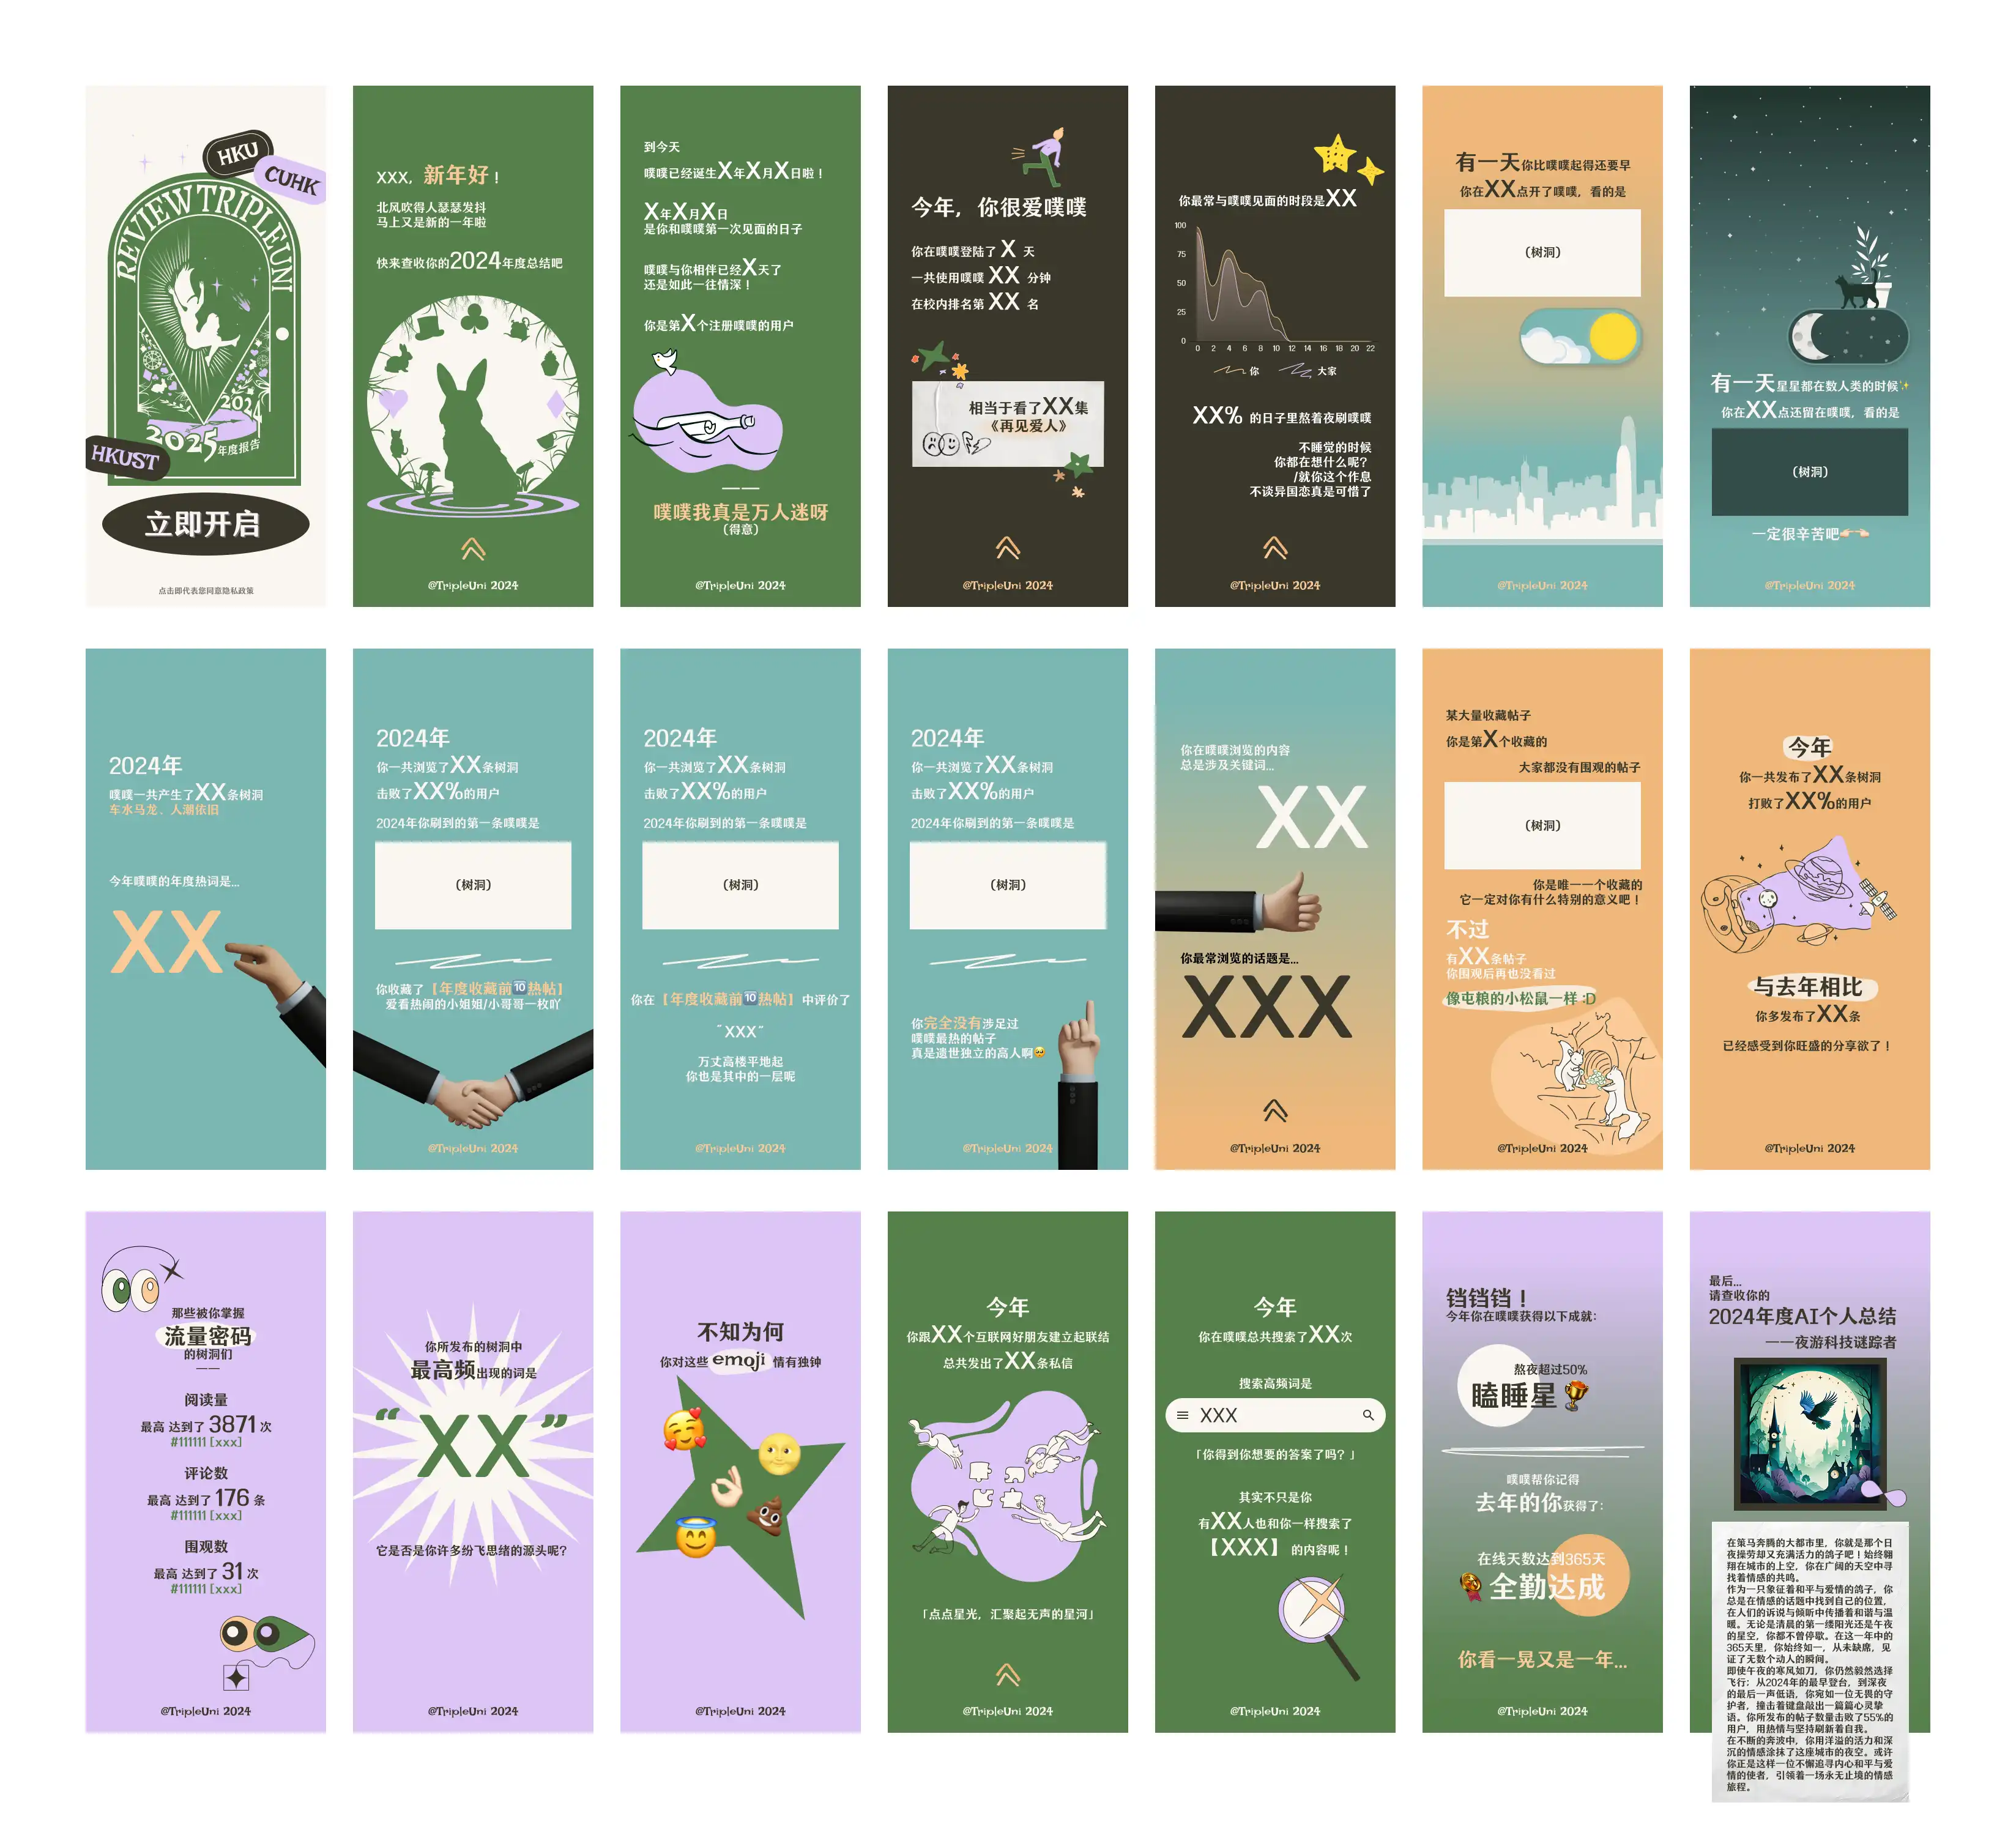
We adopted an Alice’s Adventures in Wonderland theme for our design (shown above). You may also explore our interactive prototype. We also created a design system with 5 font sizes and 6 colors ensured visual consistency.
The static prototype didn’t include animations or transitions, which were developed later during frontend implementation.
Page Framework
Upon preliminary inspection, our report can be divided into various pages that share the same behaviours:
- Each page should fill up the entire screen.
- Each page should ‘snap’ to the screen (i.e. only one page should be visible at the same time except during scrolling).
- Animations inside the page should automatically play once the page is scrolled into viewport.
- Images should be lazy loaded to improve performance.
And since we want to ensure the intended viewing experience
- User cannot scroll to the next page untill the content is fully displayed
To support such requirements, a page framework was created to handel common functionalities including page registration, display next page and execute functions on the first time a page is visible. It greatly simplifies the code and streamlines the development of new pages.
Highlights
Come back later for updates…
Viewing Statistics
A basic tracker was implimented to measure the report engagement: On the first time each page enters the viewport, the client will send a POST requesrt with the userid and the current page number to the server. We can then use this information to calculate the time spent on each page, the finish ratio and on what pages did the user leave.
View Counts
In total, we have 2658 unique users visited the 2024 year report for 4126 times.
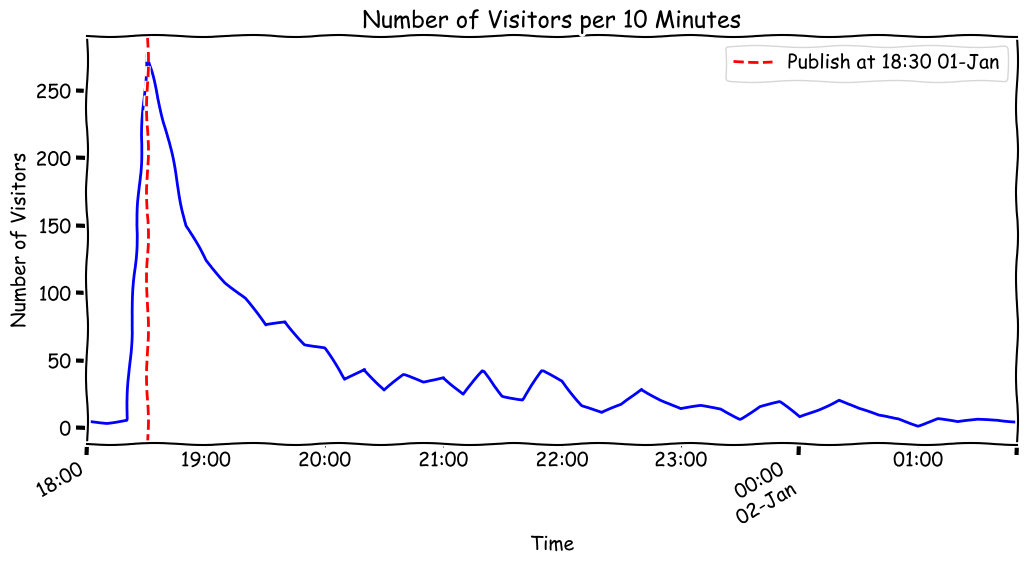
Our view count reached the pinnacle right after we published the report at Jan-01 18:30, gaining 648 views in the first 30 minutes.
Dwell Time
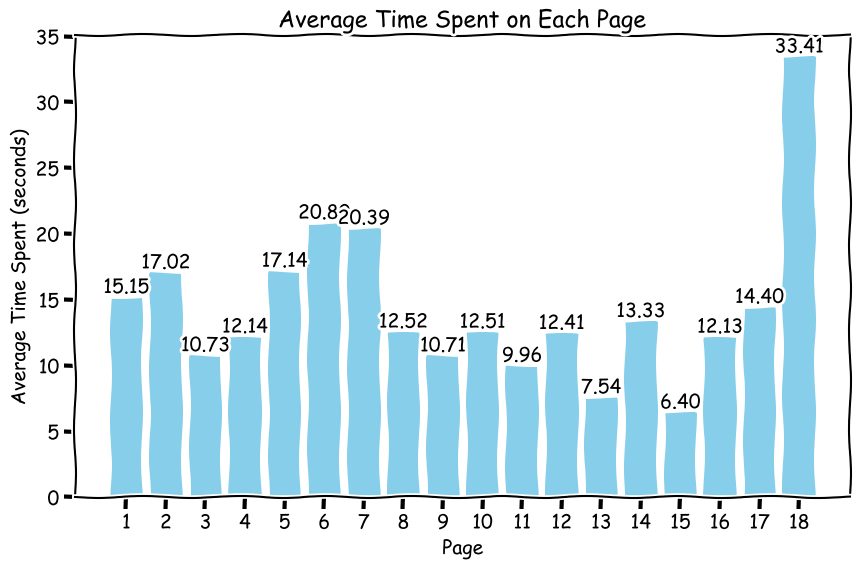
In total, all the users spent 547, 377 seconds or 152 hours in our year report.
Retention Rate
We have 62% of the users viewed the whole report (reaching page 18 or page 19).
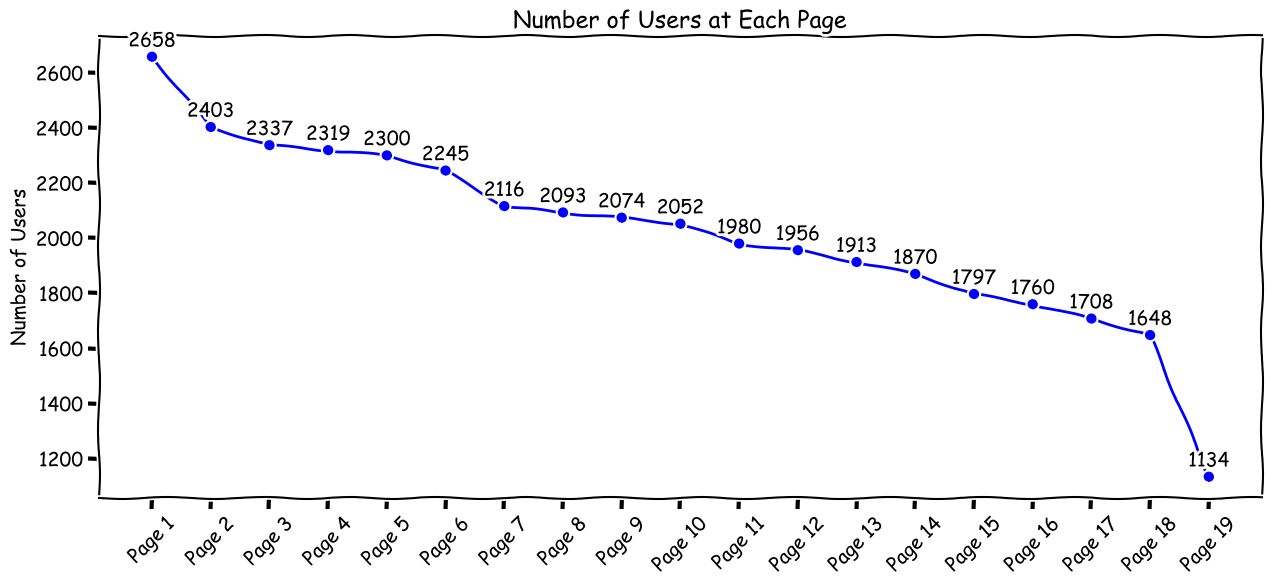
There are 3 noticible decrease in users:
- Page 1 to Page 2
- Page 6 to Page 7
- Page 18 to Page 19
The initial decline can be attributed to visitors who clicked on the link but did not proceed to view the report. The second drop may result from the requirement of horizontal scrolling in the day-night switch section. The third decrease is likely due to the long waiting time for all the generated text to appear.
These observations suggest that, in the future, we should enhance interaction cues and reduce the duration of animations to improve user experience.